
TP qube
This article discusses some of the likely impacts of the new global minimum corporate tax rate, and uses OECD CbCR data to identify countries that are likely to lose the most from it. Although the results are quite intuitive, they demonstrate the power of CbCR data.
A new tax regime with likely very large economic impacts
138 countries of the Inclusive Framework (as of July 2023) are now in favor of the implementation of the Two-Pilar Solution to Address the Tax Challenges Arising from the Digitalisation of the Economy. If successful, Pillar Two will create a new minimum global corporate tax rate of 15%. This minimum global corporate tax rate would apply to all legal entities part of a group with revenues higher than 750 MEUR, meaning that, through various mechanisms, a subsidiary whose Effective Tax Rate (ETR) would be less than 15% could be taxed by other countries so that its ETR would reach the 15% threshold.
This global corporate tax rate is likely to change the behavior of MNEs and states and change the tax competition dynamics.
Some countries have succeeded in attracting foreign investments and incentivizing MNEs to set up their regional headquarters locally. We call these countries investment hubs. These investment hubs notably implemented specific tax and legal policies, one of the main being low corporate tax rates – not only through low statutory tax rates, but also through a wide range of policies including widespread rulings -.
The implementation of a global tax rate is likely to impact disproportionately investment hubs. MNEs will have fewer incentive to set up their regional HQs in jurisdictions with low ETRs, as these subsidiaries would nonetheless be taxed by another state.
The difficulty in precisely estimating the economic impacts of the introduction of Pillar Two
The OECD has published an interesting economic impact assessment of the two pillar solution. The OECD notably estimated that the Pillar One and Pillar Two solution would be likely to increase corporate tax revenues by 50 to 80 billion euros globally. The OECD presents results only at an aggregate level and not for individual countries. For investment hubs, the OECD foresees that Pillar Two would increase tax revenues between 2% to 15%.
This estimation is based on several assumptions. In the most complex scenario presented by the OECD – scenario 4 –, the OECD tries to anticipate the response of MNEs and states following the introduction of the global minimum tax. In short, following the introduction of the global minimum tax, MNEs are likely to reduce profit shifting: only baseline profits would remain in low-tax geographies and deemed shifted profits would move to other jurisdictions. States with low ETRs may then decide to change their policies in order to increase the ETRs of MNEs located in their jurisdictions.
This approach is very insightful, but may underestimate the impact of a global minimum corporate tax for investment hubs. The impact of changes in international tax law are difficult to forecast. The effects are dynamic and across multiple periods: in a first step MNEs and states will adapt to the new rules, taking account the likely behavior of other states and MNEs. In a second step they will adjust their actions depending on the actual behavior of other players in the first step, triggering a new response by other players, and so on. A true game theory problem.
Even if the goals of the players seem clearly identifiable (profit maximization for MNEs and maximization of tax revenues for states), the uncertainties surrounding the available strategies for each player (e.g. states are constrained by their local political environment; some MNEs may be more mobile than others for reasons badly understood), as well as complex belief systems (e.g. US MNEs may anticipate tax amnesties) render the final equilibrium uneasy to predict.
One possibility would be that MNEs change their overall structure and cease to invest in some geographies, notably investment hubs. This sharp decrease of FDIs in certain geographies may then result in a significant decrease of corporate tax revenues for investment hubs (even if, again, the response of these states is hard to predict and these states could try to tax more the remaining MNEs). One paper has attempted to estimate this effect with very different results than the OECD study: in this setting, Ireland would for example be expected to lose between 11% and 23% of its corporate tax revenues.
Although this scenario is far from certain, one should be very cautious about potential feedback loops: once some MNEs will leave certain geographies, other MNEs will be incentivized to leave as well, as the local tax ecosystem may collapse, rendering local investments operationnally more complex, and as the focus of tax administrations from other geographies may increase their scrutiny on remaining firms
In this article we do not try to quantify the economic impacts of the new minimum global corporate tax, but identify the main investment hubs that we believe may be very adversely affected.
How to (quickly) identify which countries will be most impacted using CbCR data
To identify investment hubs at risk of being strongly impacted by the new minimum global tax rate, we rely on OECD Country-by-Country Reporting (“CbCR”) data . The CbCR is a framework under which large MNEs share relevant information to tax authorities (including split of revenues, profit, employees, assets, etc. by geography). The OECD presents aggregated results by country. The dataset thus provides highly relevant information on the behavior of MNEs.
Two words of caution though: as for all datasets, the quality of some of the metrics is highly dubious, in particular the ETR , as explained by the OECD itself . Besides, the dataset leverages CbCR data from 2016.
In the CbCR dataset, we claim that two variables in particular can be used to identify investment hubs:
- Related party revenues divided by total revenues – Using the CbCR dataset, this indicator is built for each country by dividing the aggregated related party revenues of all MNEs’ affiliates in the country by the aggregated total revenues of all MNEs’ affiliates in the country.
- Revenues per employee– Using the CbCR dataset, this indicator is built for each country by dividing the aggregated total revenues of all MNEs’ affiliates in the country by the total number of employees of all MNEs’ affiliates in the country.
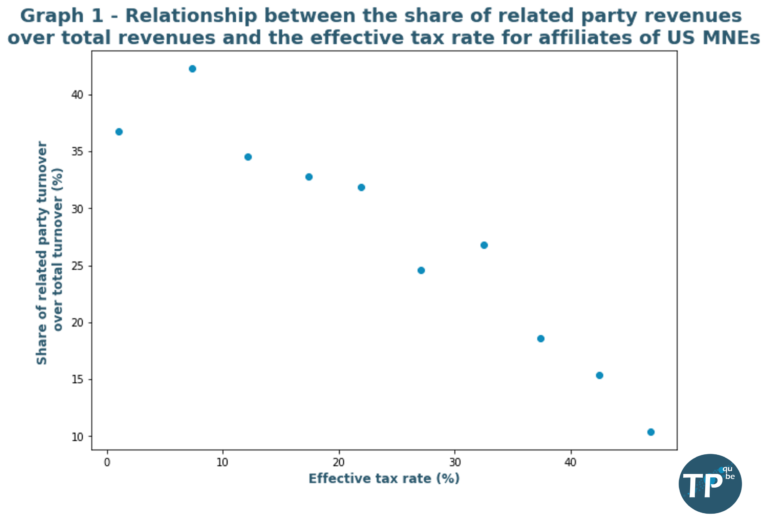
We plot below the relationship between the ETR and each of the two variables (leveraging CbCR data for US companies only). These plots suggest that countries with lower effective tax rates tend do have high related party revenues over total revenues, and high revenues per employee. This is typically the case for investment hubs.
Strong negative correlation between the share of related party revenues over total revenues over total revenues and he effective tax rate for affiliates of US MMEs
Strong negative correlation between the revenues per employee and the effective tax rate for affiliates of US MNEs
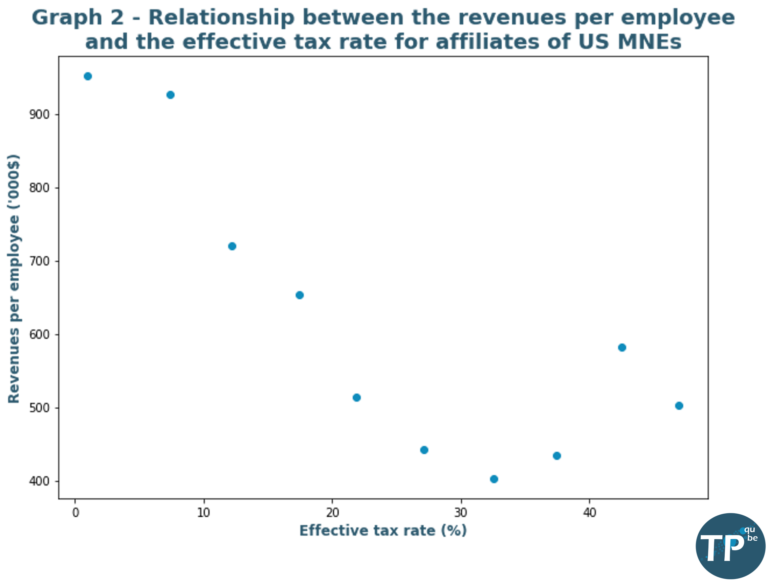
Note: To build these graphes, we use a dataset grouping all MNEs’ affiliates by ETR. Each point of the graph thus represents all MNEs’ affiliates in a certain bucket of ETR (e.g. with an ETR between 0% to 10%). Data can be found here , in table 3: Country-by-Country Report (Form 8975): Tax Jurisdiction Information (Schedule A: Part I) by Effective Tax Rate of Multinational Enterprise Sub-groups, Tax Year 2016.
Our main results are displayed in the graph below (full results are available in Appendix).
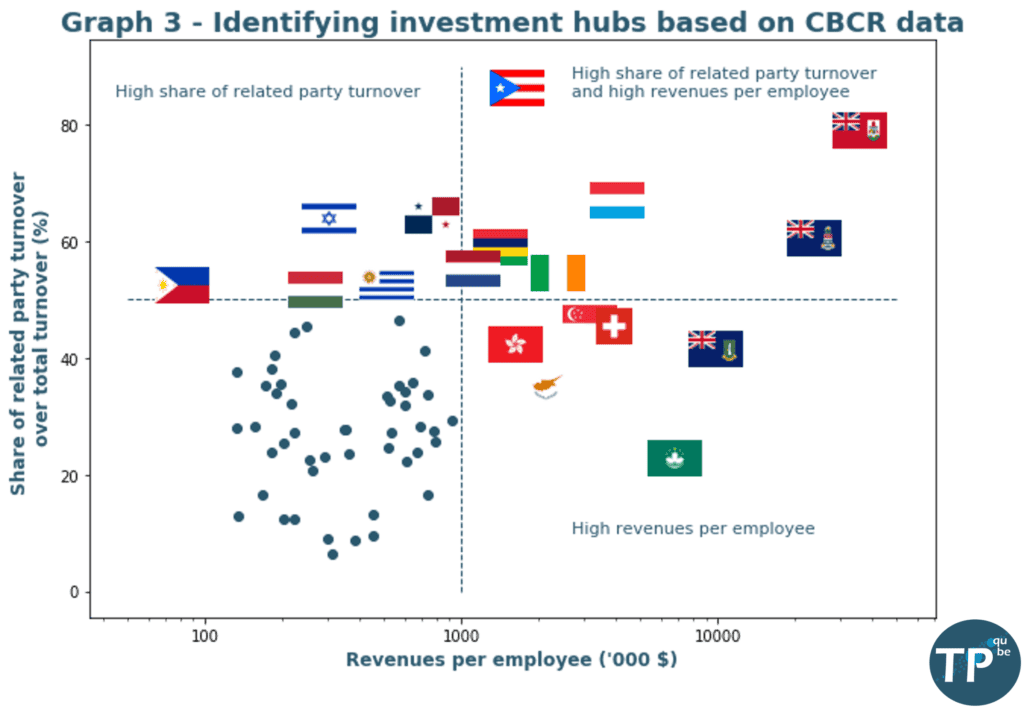
Identification of investment hubs based on CBCR data
The results are consistent with our intuition. We define clusters of countries that are the most likely to be investment hubs, using somewhat arbitrary thresholds of the two variables.
Countries with a share of related party revenues higher than 50% and revenues per employee in excess of 1 MEUR (which are the most likely to be investment hubs) include Bermuda, Cayman Islands, Luxembourg, Ireland, Mauritius, Puerto Rico and the Netherlands.
Other countries with a share or related party revenues higher than 50% OR revenues per employee in excess of 1 MEUR (which are somewhat likely to be investment hubs) include British Virgin Islands, Macao, Switzerland, Singapore, Cyprus, Hong Kong, Panama, Uruguay, Israel, Hungary and Philippines.
As stated in the box above, the economic impacts of the introduction of a global minimum corporate tax rate are hard to anticipate. In the list of investment hubs above, some states may succeed in maintaining a constant flow of FDI: states such as Ireland have real assets, such as being English speaking, in the EU, and already having a tech ecosystem locally. Other destinations such as the Cayman Islands or Bermuda are likely to be more strongly impacted.
Appendix - Full data table for graph 3
| Country | Revenue per employee ('000 $) | Related party / total revenues (%) |
|---|---|---|
| 🇧🇲 Bermuda | 36,071 | 0.79 |
| 🇰🇾 Cayman Islands | 23,775 | 0.61 |
| 🇻🇬 British Virgin Islands | 9,850 | 0.42 |
| 🇲🇴 Macau, China | 6,842 | 0.23 |
| 🇱🇺 Luxembourg | 4,071 | 0.67 |
| 🇨🇭 Switzerland | 3,922 | 0.45 |
| 🇸🇬 Singapore | 3,162 | 0.46 |
| 🇮🇪 Ireland | 2,380 | 0.54 |
| 🇨🇾 Cyprus | 2,126 | 0.35 |
| 🇵🇷 Puerto Rico | 1,640 | 0.86 |
| 🇭🇰 Hong Kong, China | 1,618 | 0.42 |
| 🇲🇺 Mauritius | 1,418 | 0.59 |
| 🇳🇱 Netherlands | 1,108 | 0.55 |
| 🇵🇦 Panama | 774 | 0.64 |
| 🇺🇾 Uruguay | 510 | 0.52 |
| 🇮🇱 Israel | 305 | 0.64 |
| 🇭🇺 Hungary | 269 | 0.52 |
| 🇵🇭 Philippines | 82 | 0.52 |