
Tp qube
👉The first part of our guide focusing on why performing a comparable company search is available here .
This article is the second part of our simplified guide on transfer pricing comparable company searches, with a focus on European searches. This guide aims at presenting the key features of comparable company searches to tax or finance professionals exposed to transfer pricing issues. The first article detailed why performing comparable company searches, while the second one tackles how to perform them in practice.
In this document, we will answer the following questions:
- Overview of the process of comparable company searches
- Searching for a set of potentially comparable companies in a specialized database
- Selecting a set of comparable companies
- Choosing of a profit level indicator
- Adjusting for differences between comparable companies and the tested party
- Computing the arm’s length range
- Implementation
Overview of the process of comparable company searches
As described in the first part of our simplified guide, comparable company searches are performed in order to establish the arm’s length nature of intragroup transactions. They are a prerequisite to a lot of transfer pricing analyses and must respect certain processes and codes.
These searches aim at identifying a set of independent companies comparable to the tested party. Following the same example as in the first part of our guide, the application of these searches is illustrated below.
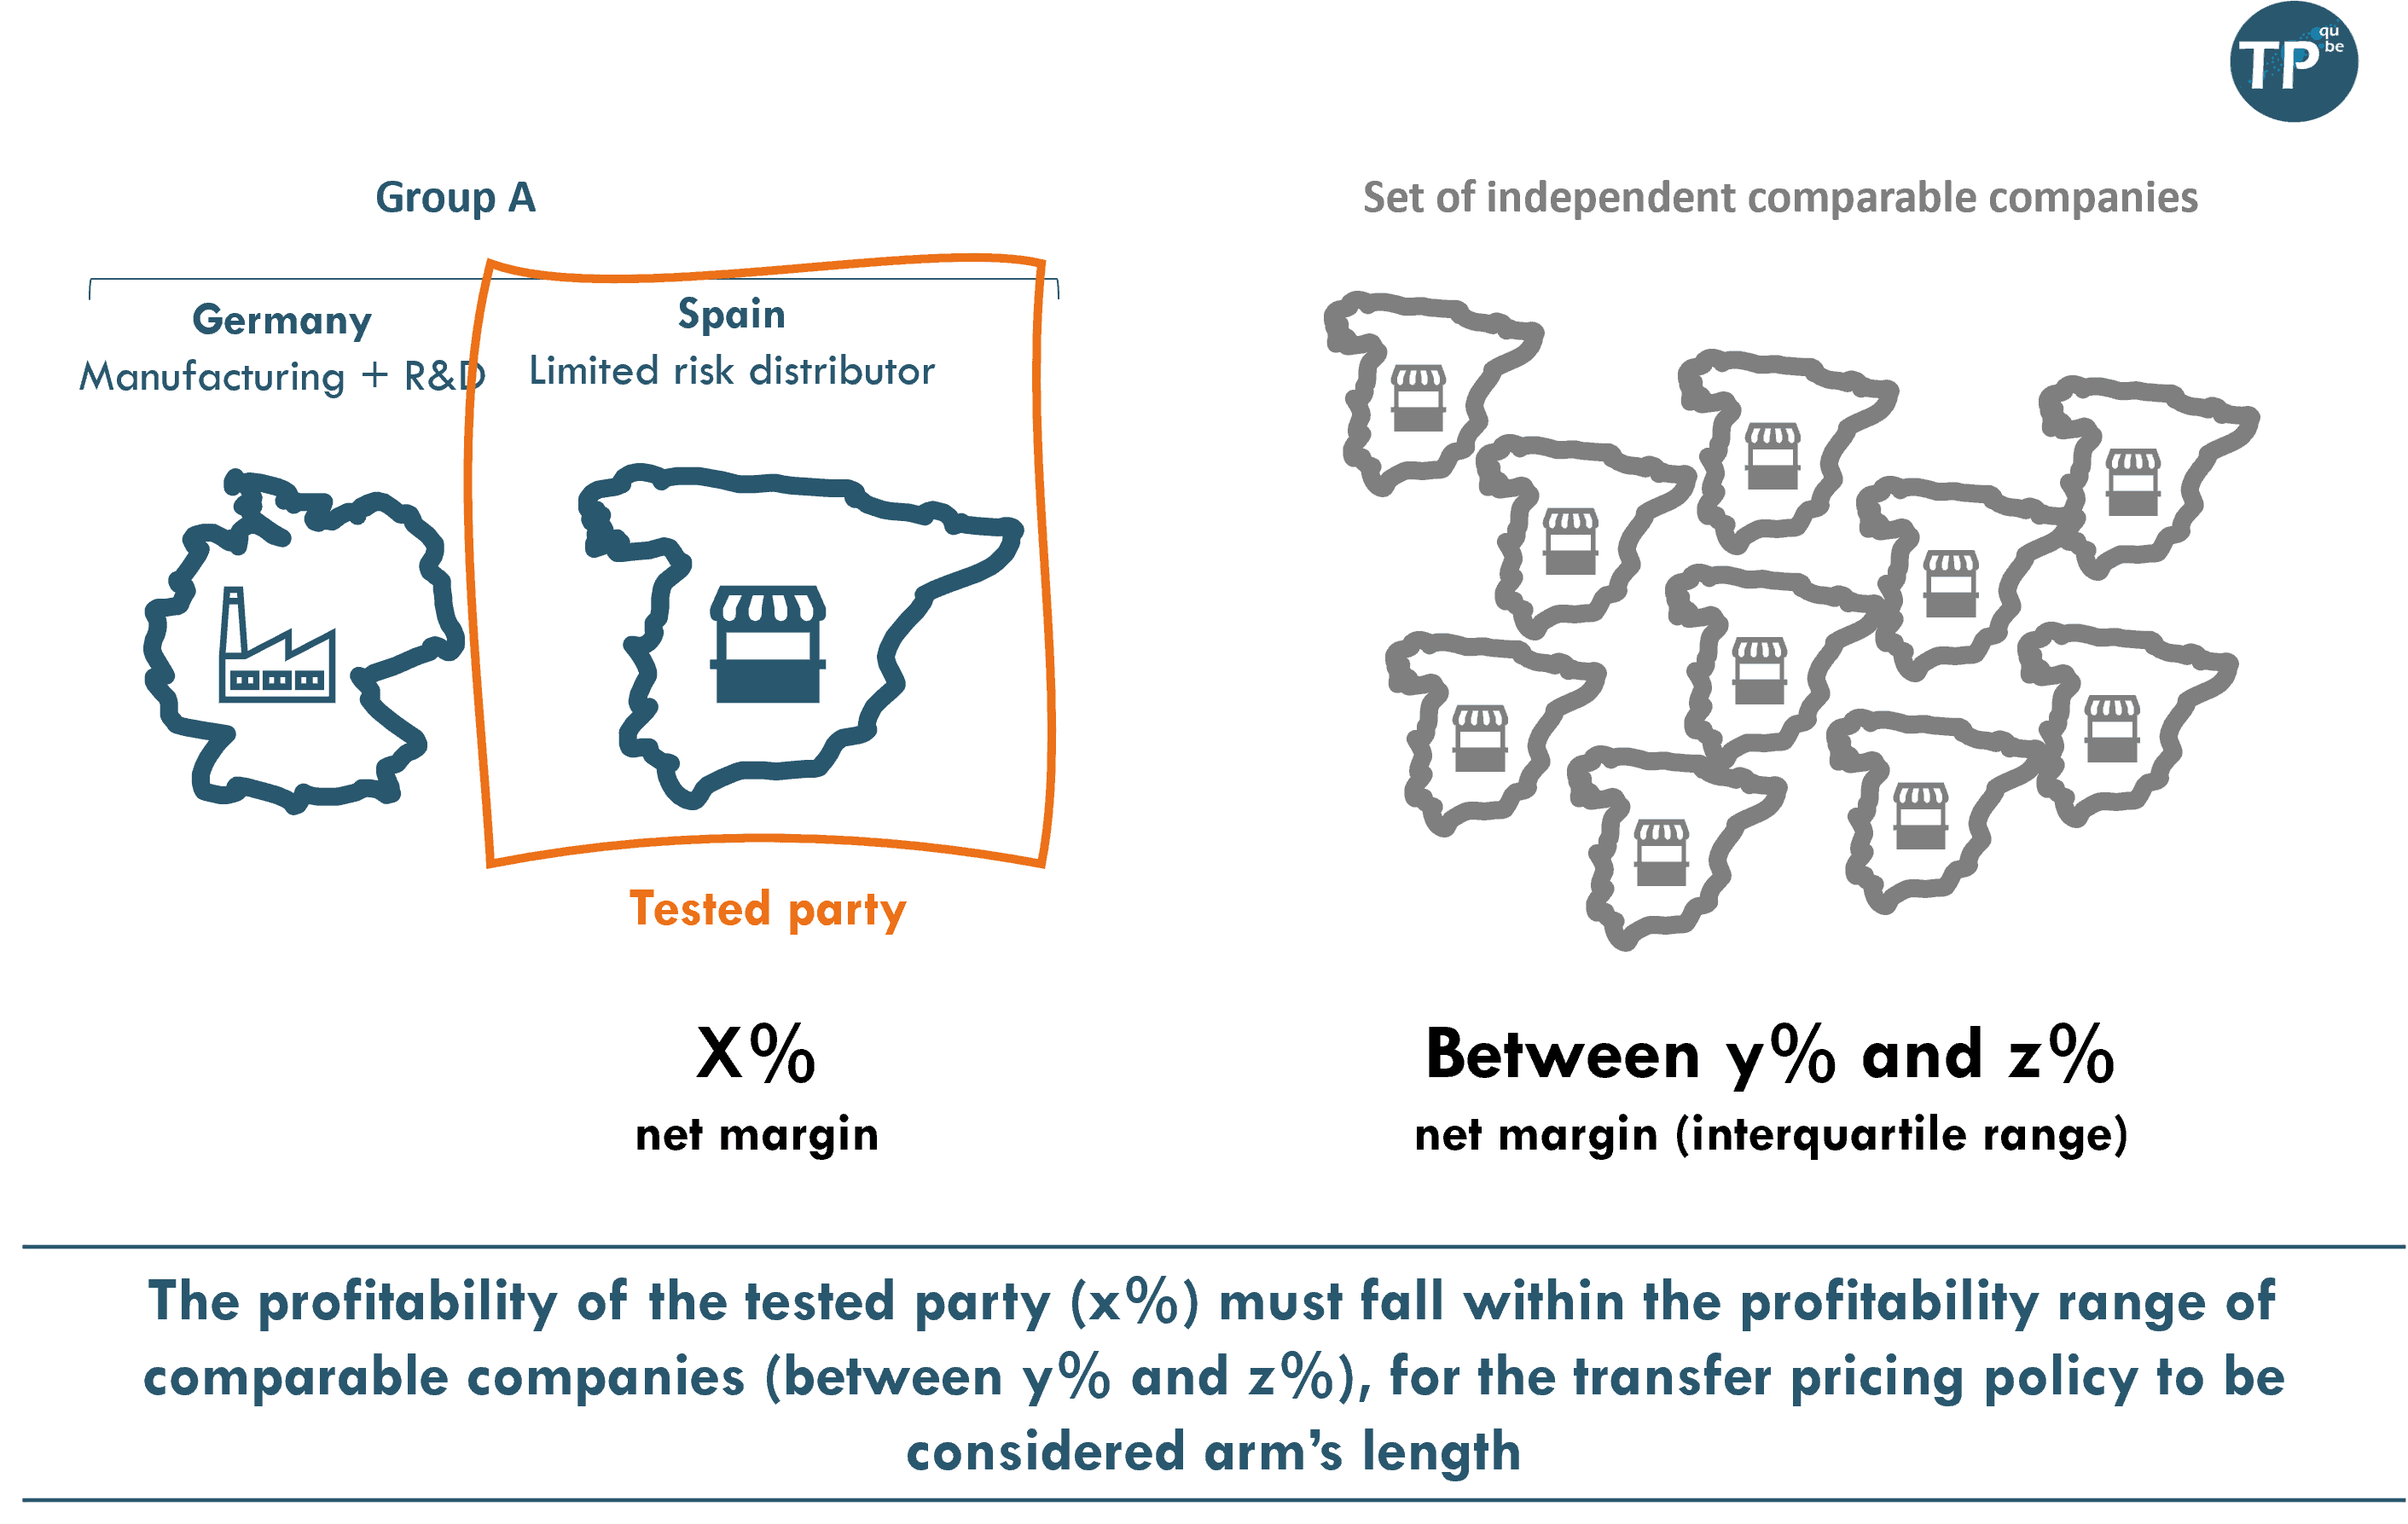
Comparable company searches aim at comparing the profitability of related companies (i.e. part of the same group) with the profitability of comparable independent companies. It is essential to rely on independent companies, as their accounts are not impacted by transfer pricing flows. For example, it would not be adequate to compare the profitability of a subsidiary of a car manufacturer A performing assembly activities, with the profitability of the subsidiary of another car manufacturer B performing similar activities. Indeed, the subsidiary of the car manufacturer B carry out intragroup transactions with other companies of the car manufacturer B, transactions which may distort the profitability of the company B.
A comparable company search usually follows a 5-step process, described in the next paragraphs:
- Searching for a set of potentially comparable companies in a specialized database
- Selecting a set of comparable companies
- Choosing a profit level indicator
- Adjusting for differences between comparable companies and the tested party
- Computing the arm’s length range
These steps must be documented, to allow tax administrations to potentially replicate these analyses. At first glance, two methods could be contemplated. The deductive method starts with a (large) list of companies and rejects the ones that do not meet comparability criteria. Conversely, the additive method creates a list of companies by adding companies that one knows are comparable (for example because they are known independent close competitors). The additive approach is not reproducible and thus unlikely to convince tax administrations and not relied upon by practitioners as a result. This is why this guide will focus on the deductive method.
Because of differences in the availability of comparable company financial data in certain countries, the exact process of comparable company searches vary from one country to the next. In practice, the requirements of tax authorities in Europe are sufficiently close that practitioners rely on the same process for comparable company searches in Europe.
Searching for a set of potentially comparable companies in a specialized database
The objective of this step is to extract a (large) list of companies meeting certain criteria. These criteria generally relate to:
- The availability of financial data during the target period
- Geographical criteria
- Industry criteria, generally based on standardized industry classifications (such as the NACE codes in Europe)
- Independence criteria, in order to select only companies whose accounts are not impacted by transfer prices
- Size criteria
- The availability of qualitative information, to allow the in-depth review in the next phase of the analysis
Applying these criteria on the database usually allows to identify a list of comparable companies of several hundreds of potentially comparable companies.
Selecting a set of comparable companies
The potentially comparable companies, whose information were extracted from the financial database in the previous step, have to be reviewed one by one to ensure that they meet comparability criteria. Practitioners usually rely on information from the financial database and from information extracted from the companies’ websites. Comparability is notably based on the following criteria:
- The similarity between the products or services sold by the tested party and the potentially comparable company – the exact degree of similarity will depend on the availability of comparable companies-
- The functions performed – for example one should distinguish companies manufacturing a product with companies distributing this product
- The presence of intangible assets – Potentially comparable companies owning very valuable intangible assets (such as patents, know-how, trademarks, etc.) are usually excluded, to rely solely on a set of comparable companies with a “routine” profile
- The independence of comparable companies – The in-depth review may allow the analyst to detect additional independence issues that were not identified by the data provider in the first place. Non independent companies must be rejected
- The availability of information – Companies providing insufficient information on their activities are also excluded
The size of the final set of comparable companies tend to vary widely from one search to the next.
What TP qube’s tools offer
We consider that companies’ websites are the most valuable and trustworthy source of information on their activities. As a result we favour using websites for the review of potentially comparable companies and have developed automated tools to analyze corporate websites. The companies’ review by an analyst is facilitated by our tools. The quality of the analysis is also greatly improved, notably by additional error detection mechanisms.
These tools scroll through entire corporate websites of potentially comparable websites. The text of these websites is analyzed, to extract relevant information allowing to assess the comparability of companies. The information extracted include a description of the activity, keywords, etc. Our tools also look for specific clues indicating if a company is independent or not.
Choosing a profit level indicator
The profit level indicator is chosen based on the functional analysis. The financial items impacted by the transfer pricing policy are generally not used for the computation, to avoid circularity. The table below details the most widely used PLI in transfer pricing analyses relying on the TNMM.
Ratios used as PLI in most transfer pricing analyses

The profit ratios of the selected companies are computed based on financial data, generally provided by the same financial database. These ratios are usually computed using weighted averages with a 3 or 5 year period, as using data on several years allow to smooth fluctuations in the profitability of companies (related for example to business cycles).
Adjusting for differences between comparable companies and the tested party
Profit level indicator may then be adjusted to correct certain differences between the tested party and the selected comparable companies (regarding differences in working capital, in country risk, in size, etc.).
These adjustments are performed more or less routinely depending on the geography where the study is used.
Computing the arm's length range
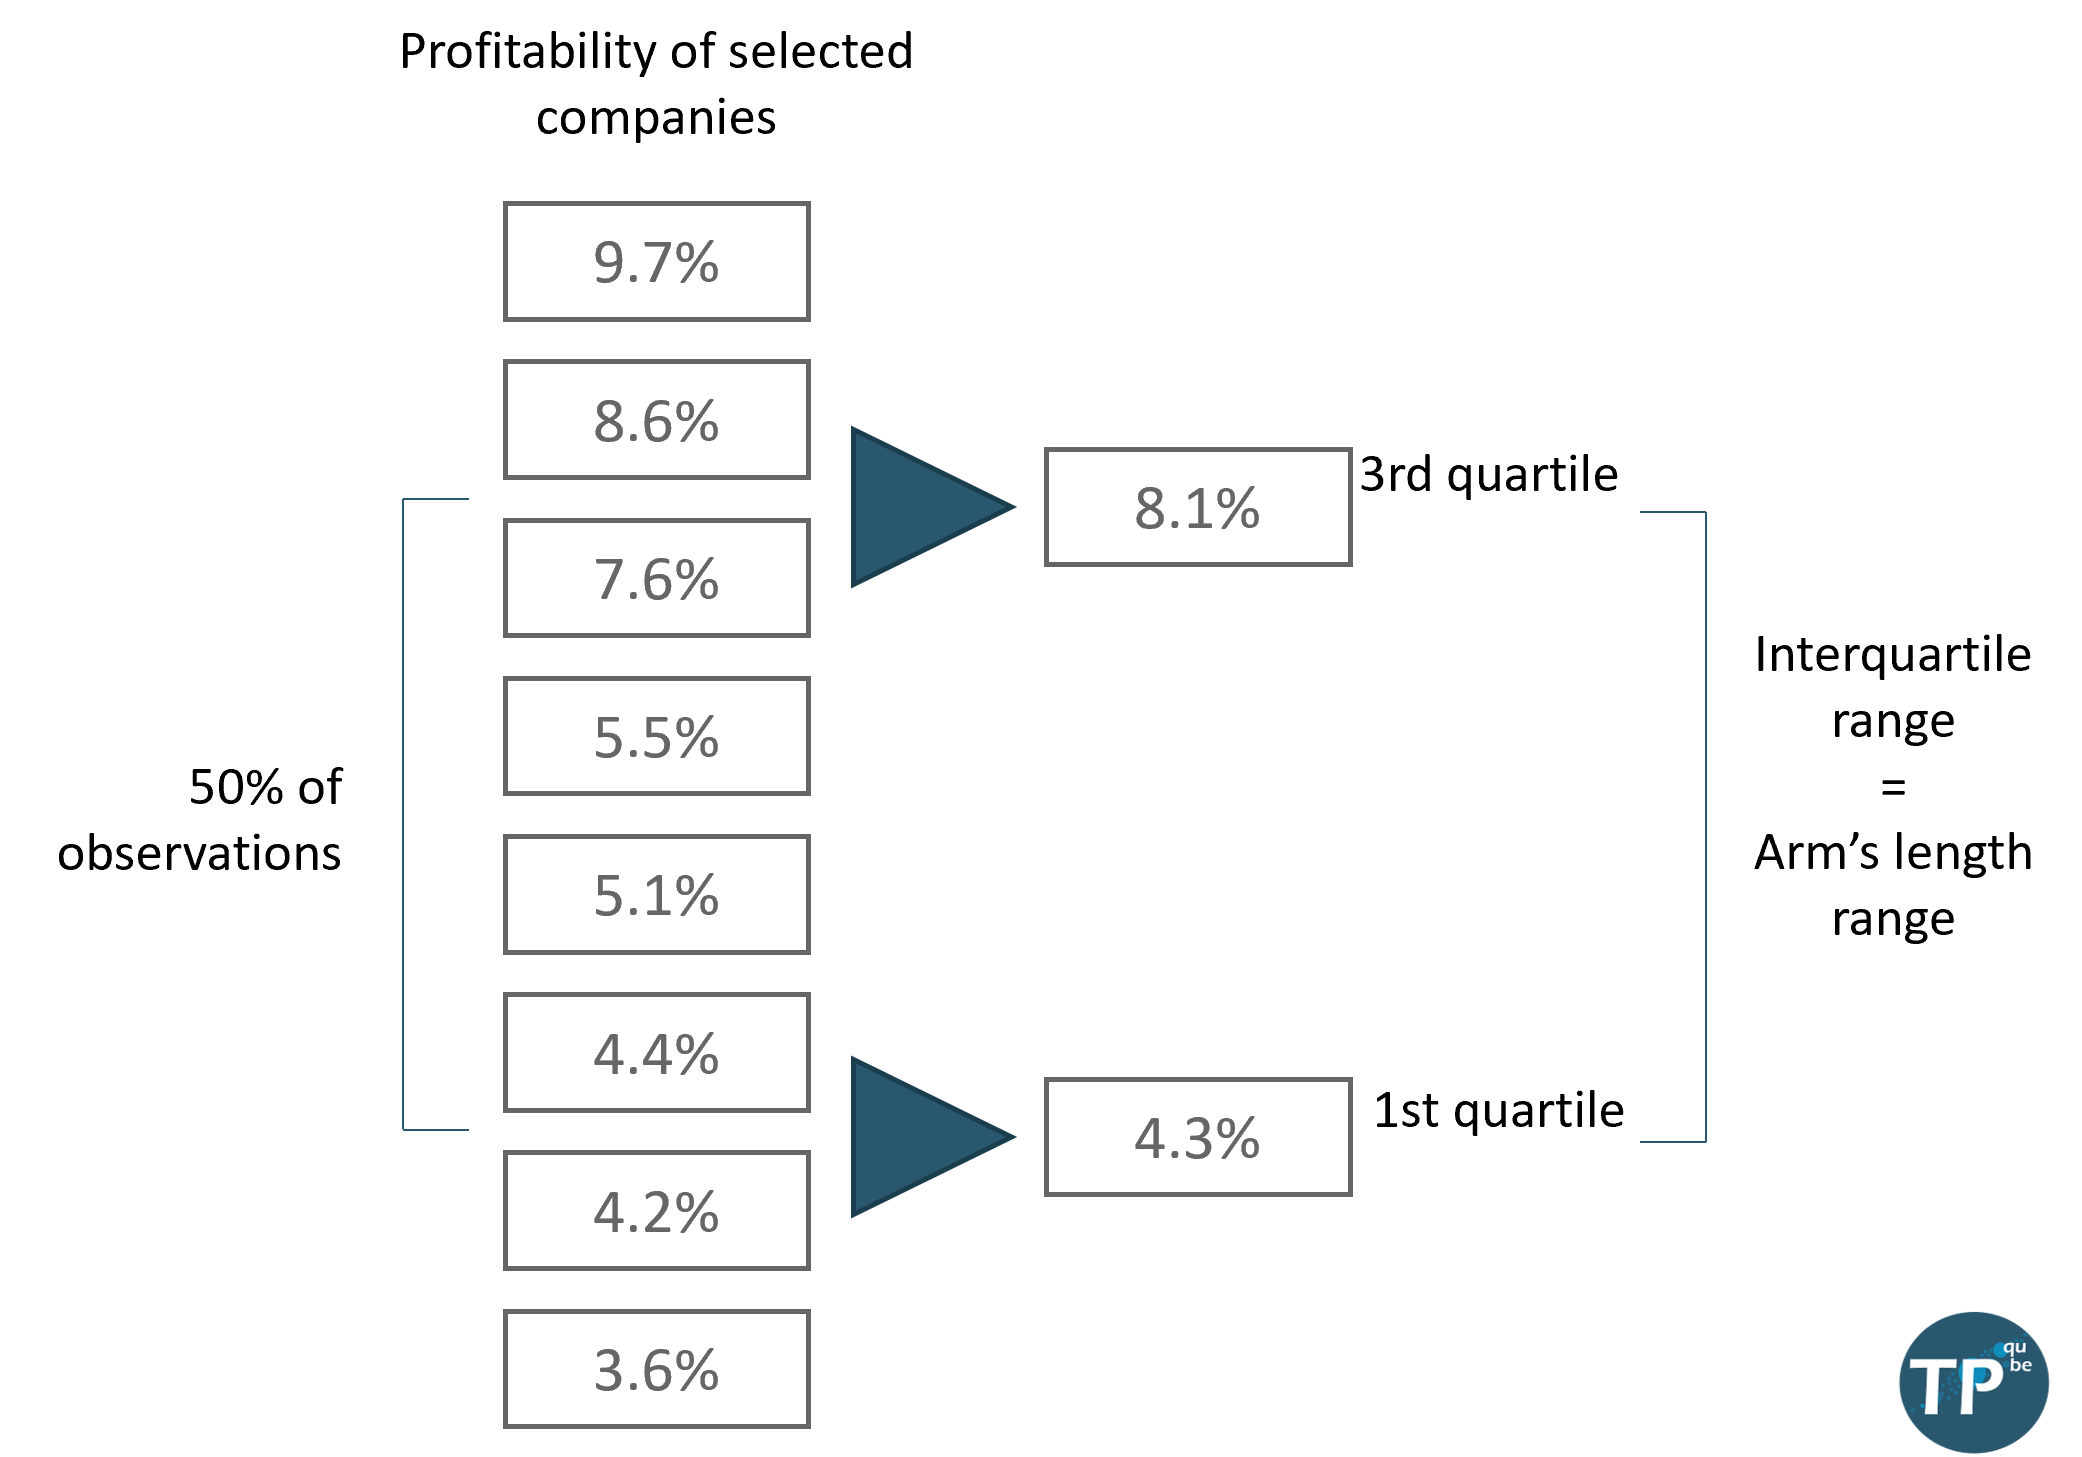
The arm’s length range is usually defined as the interquartile range (i.e. the range comprised between the first and third quartile) of the profitability distribution of the selected comparable companies. This interquartile range may be computed on two different sets of data:
- Using the weighted average – By considering only one profitability observation per selected comparable company. For each company this observation is computed as the weighted average of the PLI.
- Using a “pooling” dataset – By considering one profitability observation per selected comparable company per year.
In comparable companies search for the United States, a specific approach is retained to compute the interquartile range.
Computing an interquartile range
Implementation
There are two main ways to apply the results of a comparable company search:
- In price setting – the study is then used to determine intragroup prices during the fiscal year. The intragroup prices are usually determined based on budgeted data, and discrepancies with real data may have to be rectified during the year or through year-end adjustments.
- In price testing – the study is used at the end of the year to confirm that the realized profitability of the tested party is in line with the one of comparable companies. If the tested party’s profitability falls outside the arm’s length range, transfer pricing adjustments may be appropriate.
It is generally considered appropriate to update the financial information of selected companies every three years, but to fully update the search only every three years (also the practice differs depending on the country).