
TP qube
We did the math! 🤓
🧮 A tool to get estimations related to a specific benchmark is now available ! Follow the link.
Regular updates are crucial for TNMM / CPM benchmarks. The OECD recommends updating database searches every three years, while updating financial data annually. As a result, updating financials for benchmarks once a year has become the standard practice in most of the TP industry. But how bad is it if you do not follow this practice? This article provides a mathematical perspective on these questions.
👉 If you need a reminder on benchmarks used for the Transactional Net Margin Method (“TNMM”, called the Comparable Profits Methods or “CPM” in the US), check our 2-part guide (part 1 and part 2).
For TNMM / CPM benchmarks, the standard practice consists in updating financial data on an annual basis
As market conditions change over the years, regular updates are necessary for TNMM benchmarks. In its 2022 Guidelines[1], the OECD recommends :
« In order to simplify compliance burdens on taxpayers, tax administrations may determine, as long as the operating conditions remain unchanged, that the searches in databases for comparable companies supporting part of the local file be updated every three years rather than annually. Financial data for the comparable companies should nonetheless be updated every year in order to apply the arm’s length principle reliably.”
As emphasized by the OECD, performing a comparable company update is a relatively simple task that can (and should) be done every year. In contrast, conducting a new search from scratch is a more significant undertaking that is typically done less frequently.
The practice of financial annual updates for benchmarks has become the standard approach in a majority of the transfer pricing industry. Many MNEs may however be reluctant to follow this advice – particularly for cost associated reasons or lack of time. This leads us to wonder: by not adhering to this practice, what potential risks are these MNEs exposing themselves to?
What our research suggests: there is approximately a 1 in 3 chance of falling outside the arm's length range after two years if your benchmark includes only 10 comparable companies.
The risk for not updating a benchmark’s financials is straightforward[2]. If you define your target margin during year N based on a benchmark carried out during year N (or slightly after), your target margin may not fall within the arm’s length range in the next years (N+1, N+2…).
It is crucial to be especially cautious regarding this impact: the easiest method for tax authorities to question your target margin is not by conducting a new comparable company search, but by updating the financial information of the benchmark you provided. In addition, it is likely that tax authorities will challenge the selection of some comparable companies, increasing the risk of a reassessment.
This article aims to provide a mathematical perspective by simulating the likelihood that a target margin will fall outside the arm’s length range[3] over time. In other words, if you select a point within the arm’s length range, what is the likelihood of falling outside the arm’s length range with no update, after a couple of years?
Various factors can impact the outcome of a comparable company search update. These factors notably include:
- The number of comparable companies in the sample – During a comparable company search, there is a trade-off between selecting a larger number of companies and ensuring their proximity to the target company. In general, selecting a larger number of companies from a dataset can lead to selecting companies that are less comparable. However, this issue can be addressed by leveraging artificial intelligence techniques, thereby increasing the search space. By including more comparable companies in the search, the results are more likely to be stable.
- The percentage of companies that no longer meet the search criteria and must be excluded from the updated sample – During a benchmark update, some companies may need to be excluded from one year to the next because they no longer meet the search criteria. In some cases, the search criteria can be relaxed to include more comparable companies. Based on our experience, we have found that approximately 25% of the companies cannot be included from one year to the next. This percentage can vary depending on the country, with, for e.g., France having a higher percentage due to an increasing number of French companies applying for confidentiality measures for their financial accounts.
- The level of volatility in the profitability of the companies over time – Profitability volatility can vary significantly between industries and companies. For instance, companies in the logistics sector often experience sharp fluctuations in profitability. A high level of profitability volatility can result in a higher frequency of updates required.
- The shape of the distribution of the companies’ profitability.
- Economic cycles and trends in profitability within the industry, as well as for individual comparable companies – Economic cycles and trends in profitability can have a significant impact on the arm’s length margin. However, these factors are highly industry-specific and time-specific, so they are not incorporated into our simulations. Nonetheless, it is important to acknowledge that they can greatly affect the profitability of comparable companies and the need to update the search.
Our simulations focus on the impact of the three first factors identified: (i) the number of comparable companies, (ii) the percentage of companies that no longer meet the search criteria and must be excluded from the updated sample, (iii) the level of volatility in the profitability of the companies over time.
Our approach is based on the Monte Carlo method, with 6,000 simulations. For each simulation, we fix the number of comparable companies (N), and follow 2 steps:
- Step 1 – We determine randomly the margin levels for the N comparable companies, based on observed empirical profitability distribution for pan-European benchmarks. Profitability have been estimated for three years by integrating the possible evolution of profitability from one year to another.
- Step 2 – We simulate the effect of updates one year after the other: some companies are (randomly) dropped from our sample, and the profitability of the companies remaining in the sample may vary based on observed volatility for pan-European benchmarks. The updated profitability is computed by replacing the financials of the last year of the three years period by new ones.
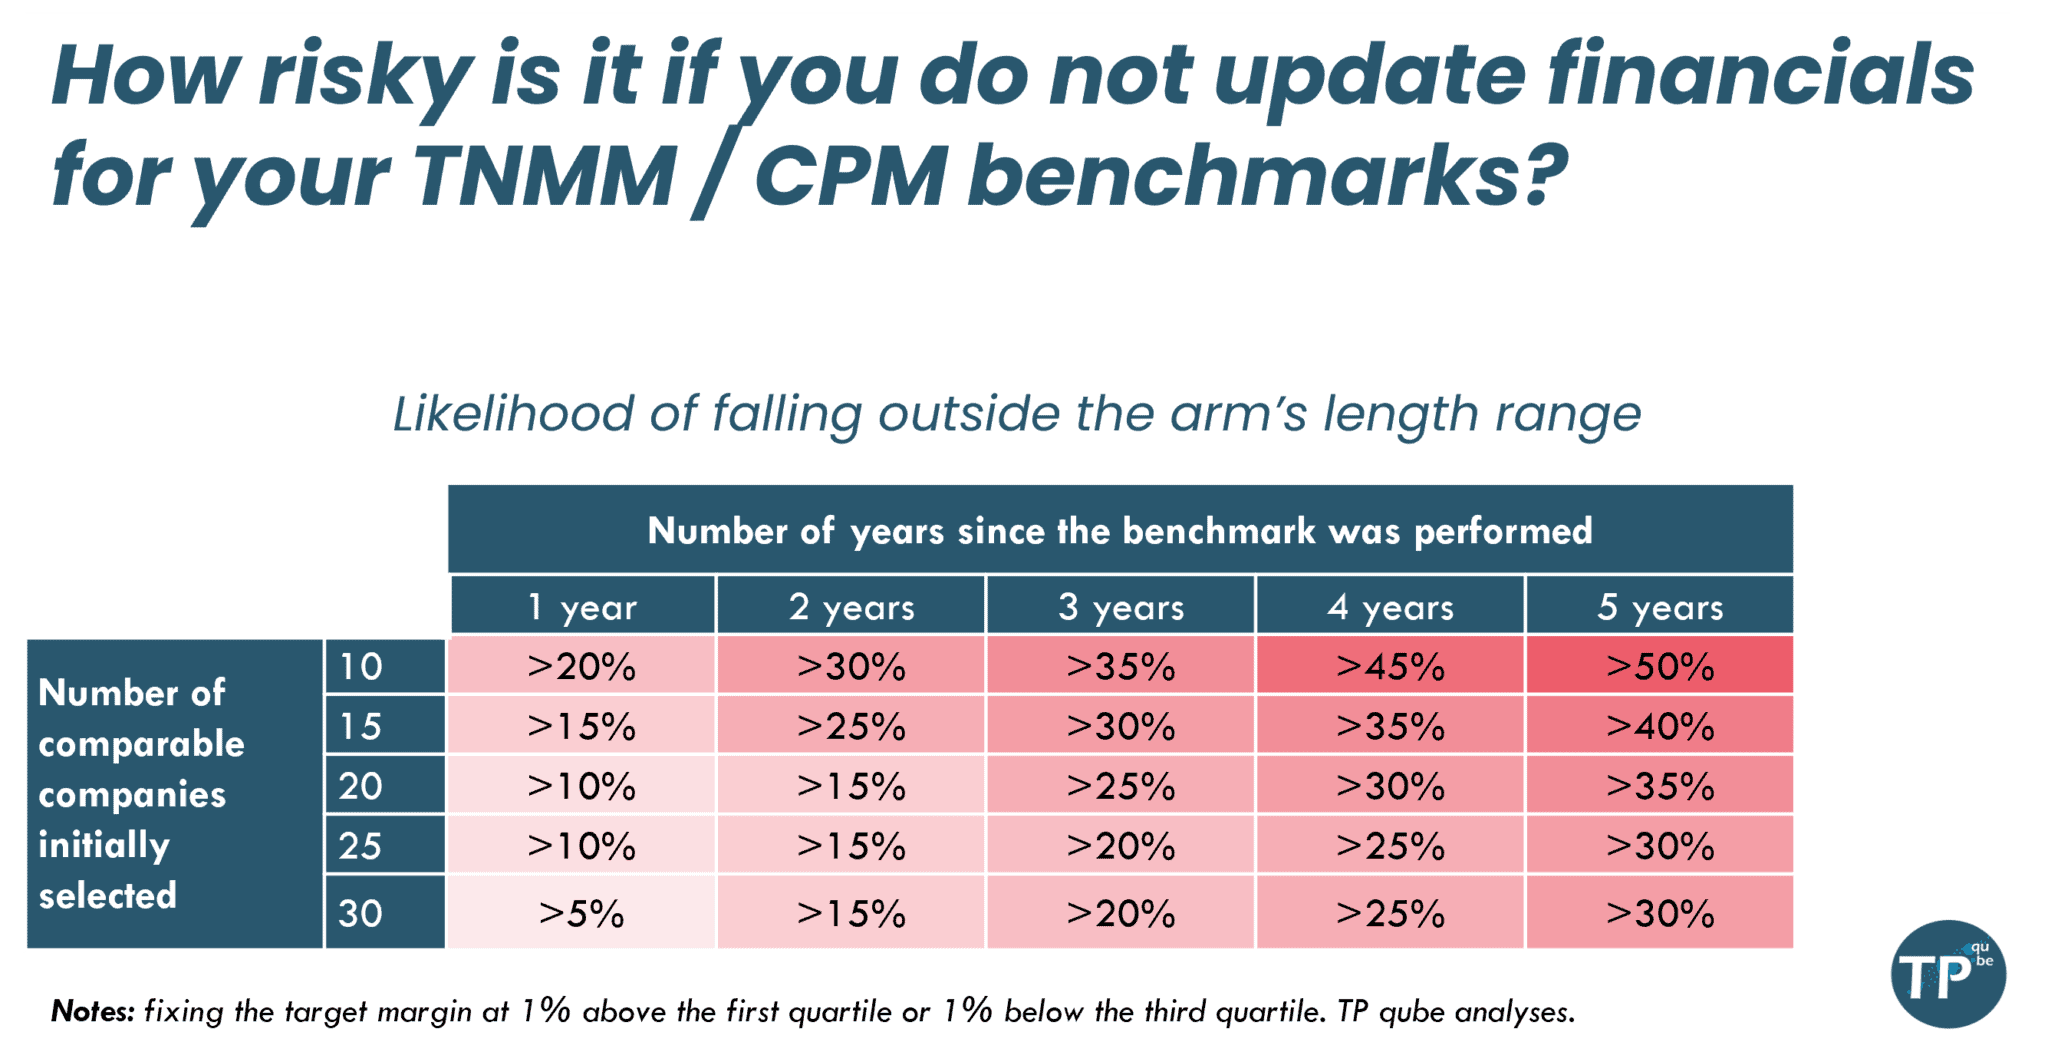
The table below provides estimations of the likelihood that a chosen target margin will fall outside the interquartile range over the years. This analysis is based on a classical pan-European benchmark. The target rate has been set below to 1% above the first quartile or 1% below the third quartile, and we discuss next targeting the median.
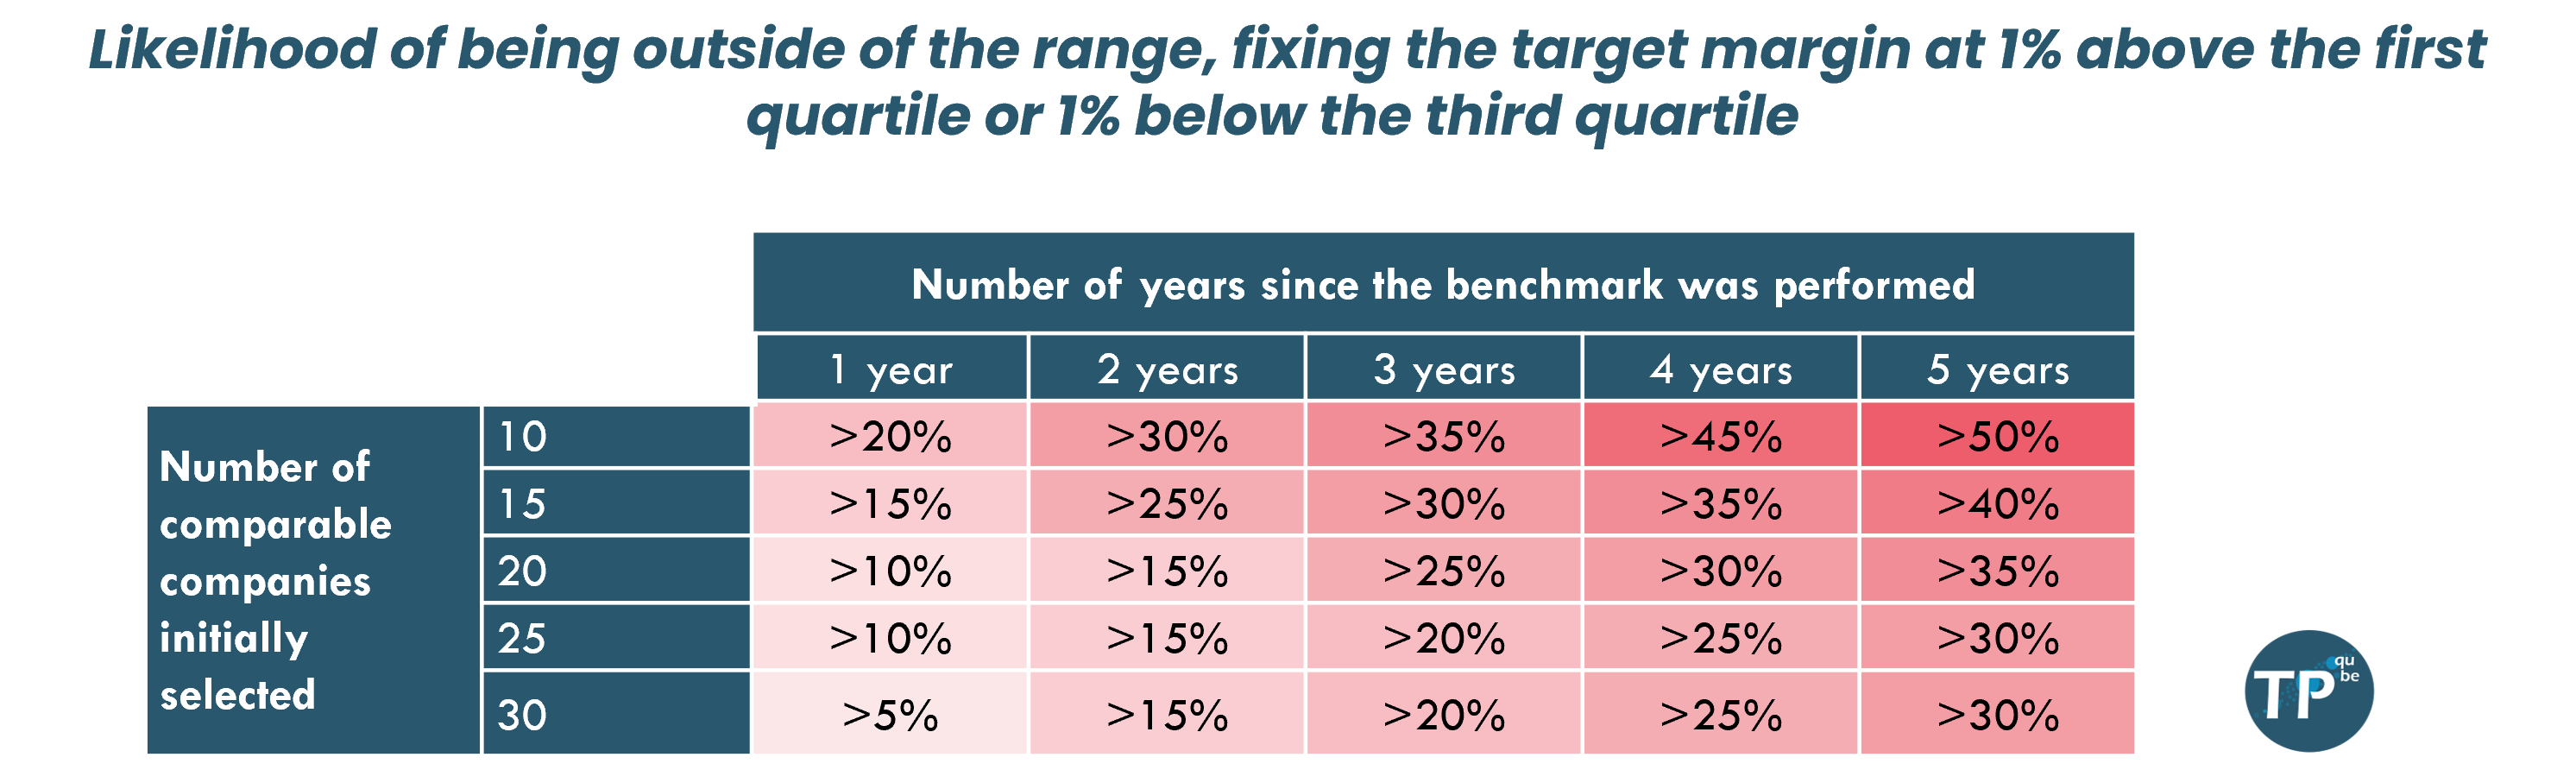
The probability of the retained rate being outside the interquartile range increases gradually over time and decreases with the number of initially selected companies. For example, with 10 initially selected comparable companies, the probability of the retained rate being outside the interquartile range is >20% after the first year and >50% after five years. With 25 initially selected comparable companies, the probability is lower, with a >10% probability after the first year and 30% after 5 years. It is important to note that these probabilities are based on assumptions and may vary depending on industry and economic trends as well as the search characteristics in itself.
The results are less dramatic, when choosing the median point as the target profitability ratio.
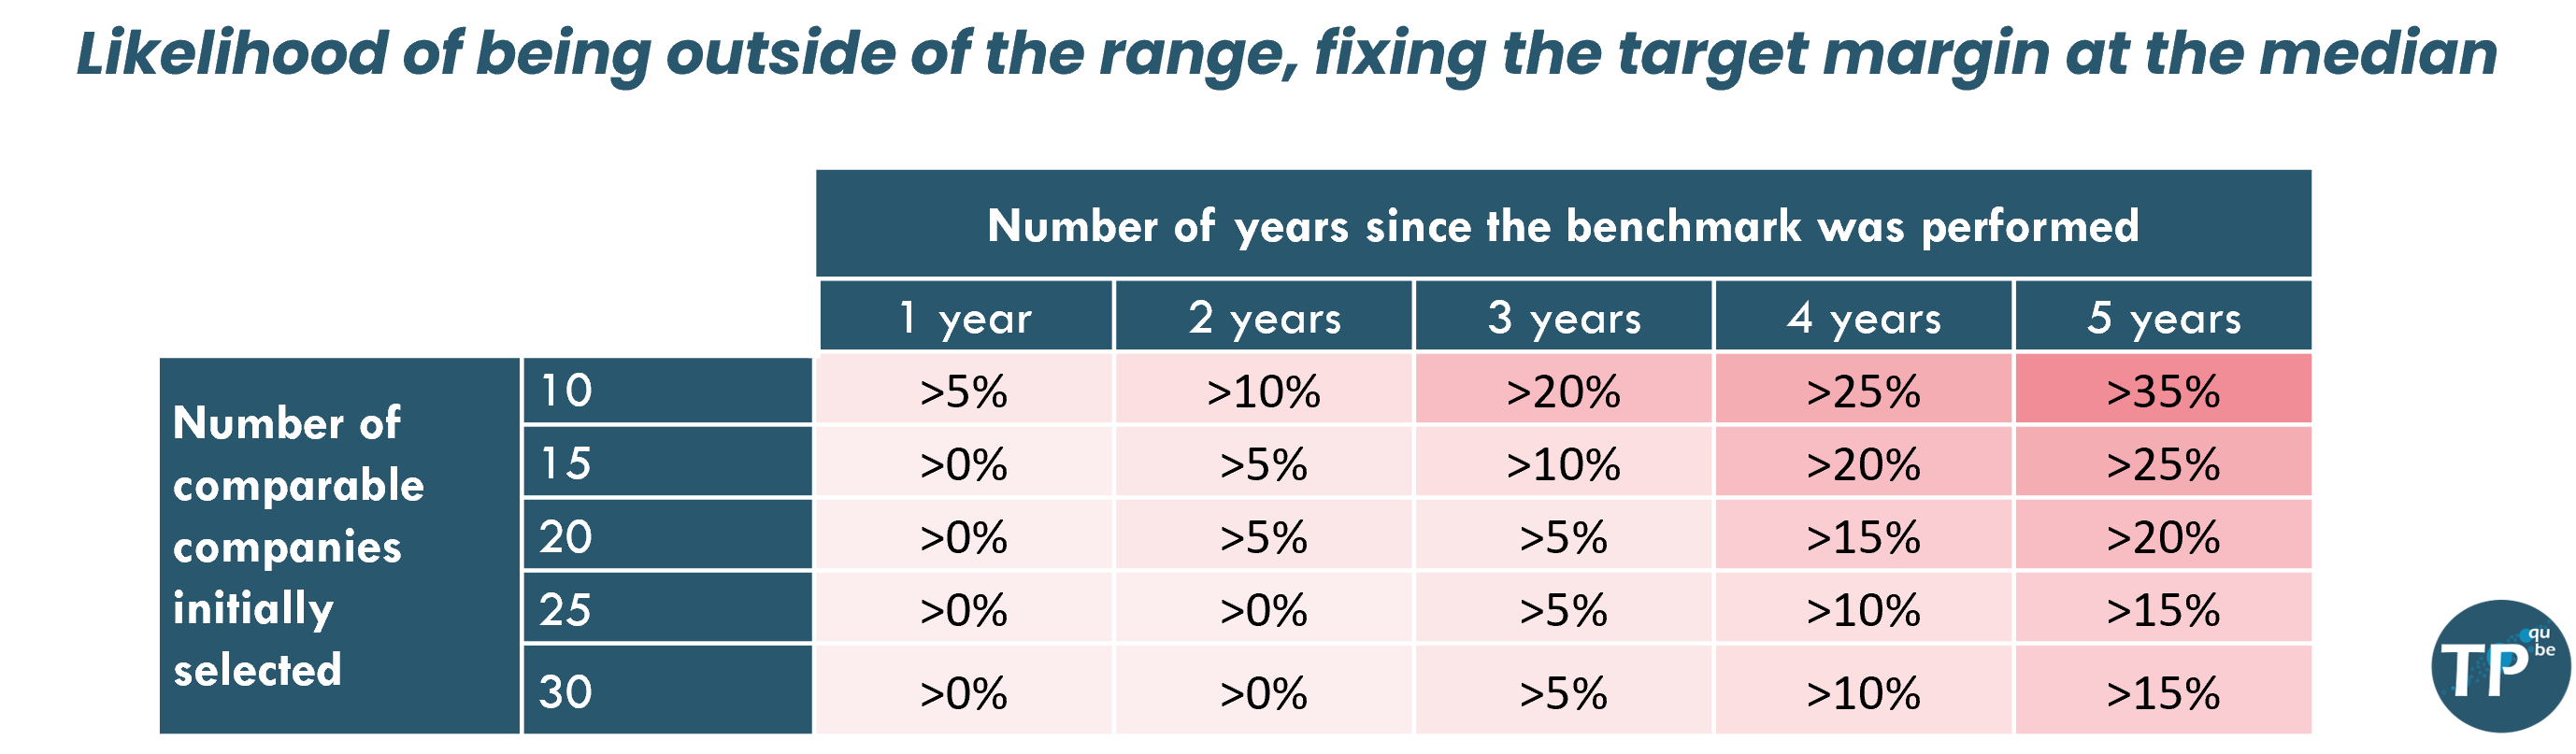
These results still suggest that benchmarks not updated regularly could rapidly lose their relevance. These results are very conservative, as they do not capture the effect of economic cycles or changes in the trends of profitability in an industry. Unsurprisingly, the risk to fall outside the interquartile range is lower if (i) the number of comparable companies is higher, (ii) the target profitability ratio is the median rather than a point closer to the boundaries of the interquartile range.
In a Nutshell
To wrap things up, keeping your TNMM benchmarks updated is crucial for maintaining accurate transfer pricing policies and mitigating risks during tax audits. Our study reveals that not updating benchmarks yearly increases the likelihood of a chosen rate falling outside the arm’s length range, which can raise questions during tax audits. The risk of deviation is reduced by increasing the number of relevant comparable companies[4] and selecting the median point as the target profitability ratio. Given the OECD’s recommendations and the mathematical perspective provided, it is clear that regular updates are crucial for ensuring compliance with transfer pricing guidelines and minimizing potential issues with tax authorities.
Being proactive is the name of the game. Investing in routine updates not only solidifies your transfer pricing policy but also protects you from unpleasant surprises during tax audits.
[1] OCDE (2022), OECD Transfer Pricing Guidelines for Multinational Enterprises and Tax Administrations 2022, Éditions OCDE, Paris, https://doi.org/10.1787/0e655865-en.
[2] Apart from specific penalties for countries where annual updates are mandatory.
[3] In our simulations, we consider the interquartile range to be the arm’s length range.
[4] With the help of our AI tools, we can do just that 😉.