
Tp qube
The number of comparable companies in a TNMM search can vary widely, from as few as five to more than fifty. Smaller sets are naturally more vulnerable to tax authority challenges: the removal or addition of a single company can significantly shift the arm’s length range[[1]](#footnote).
The central question is: can we quantify the risk of using small samples? We go beyond the usual qualitative assertions (“it depends on the facts and circumstances”) and provide concrete quantitative insights from a statistical and simulation-based approach.
To test this, we modeled a hypothetical scenario where both the taxpayer and the tax authority perform separate TNMM searches, drawing from the same underlying profitability distribution. In this setup, any difference between the two benchmarks is driven purely by sampling variation (i.e. “luck”).
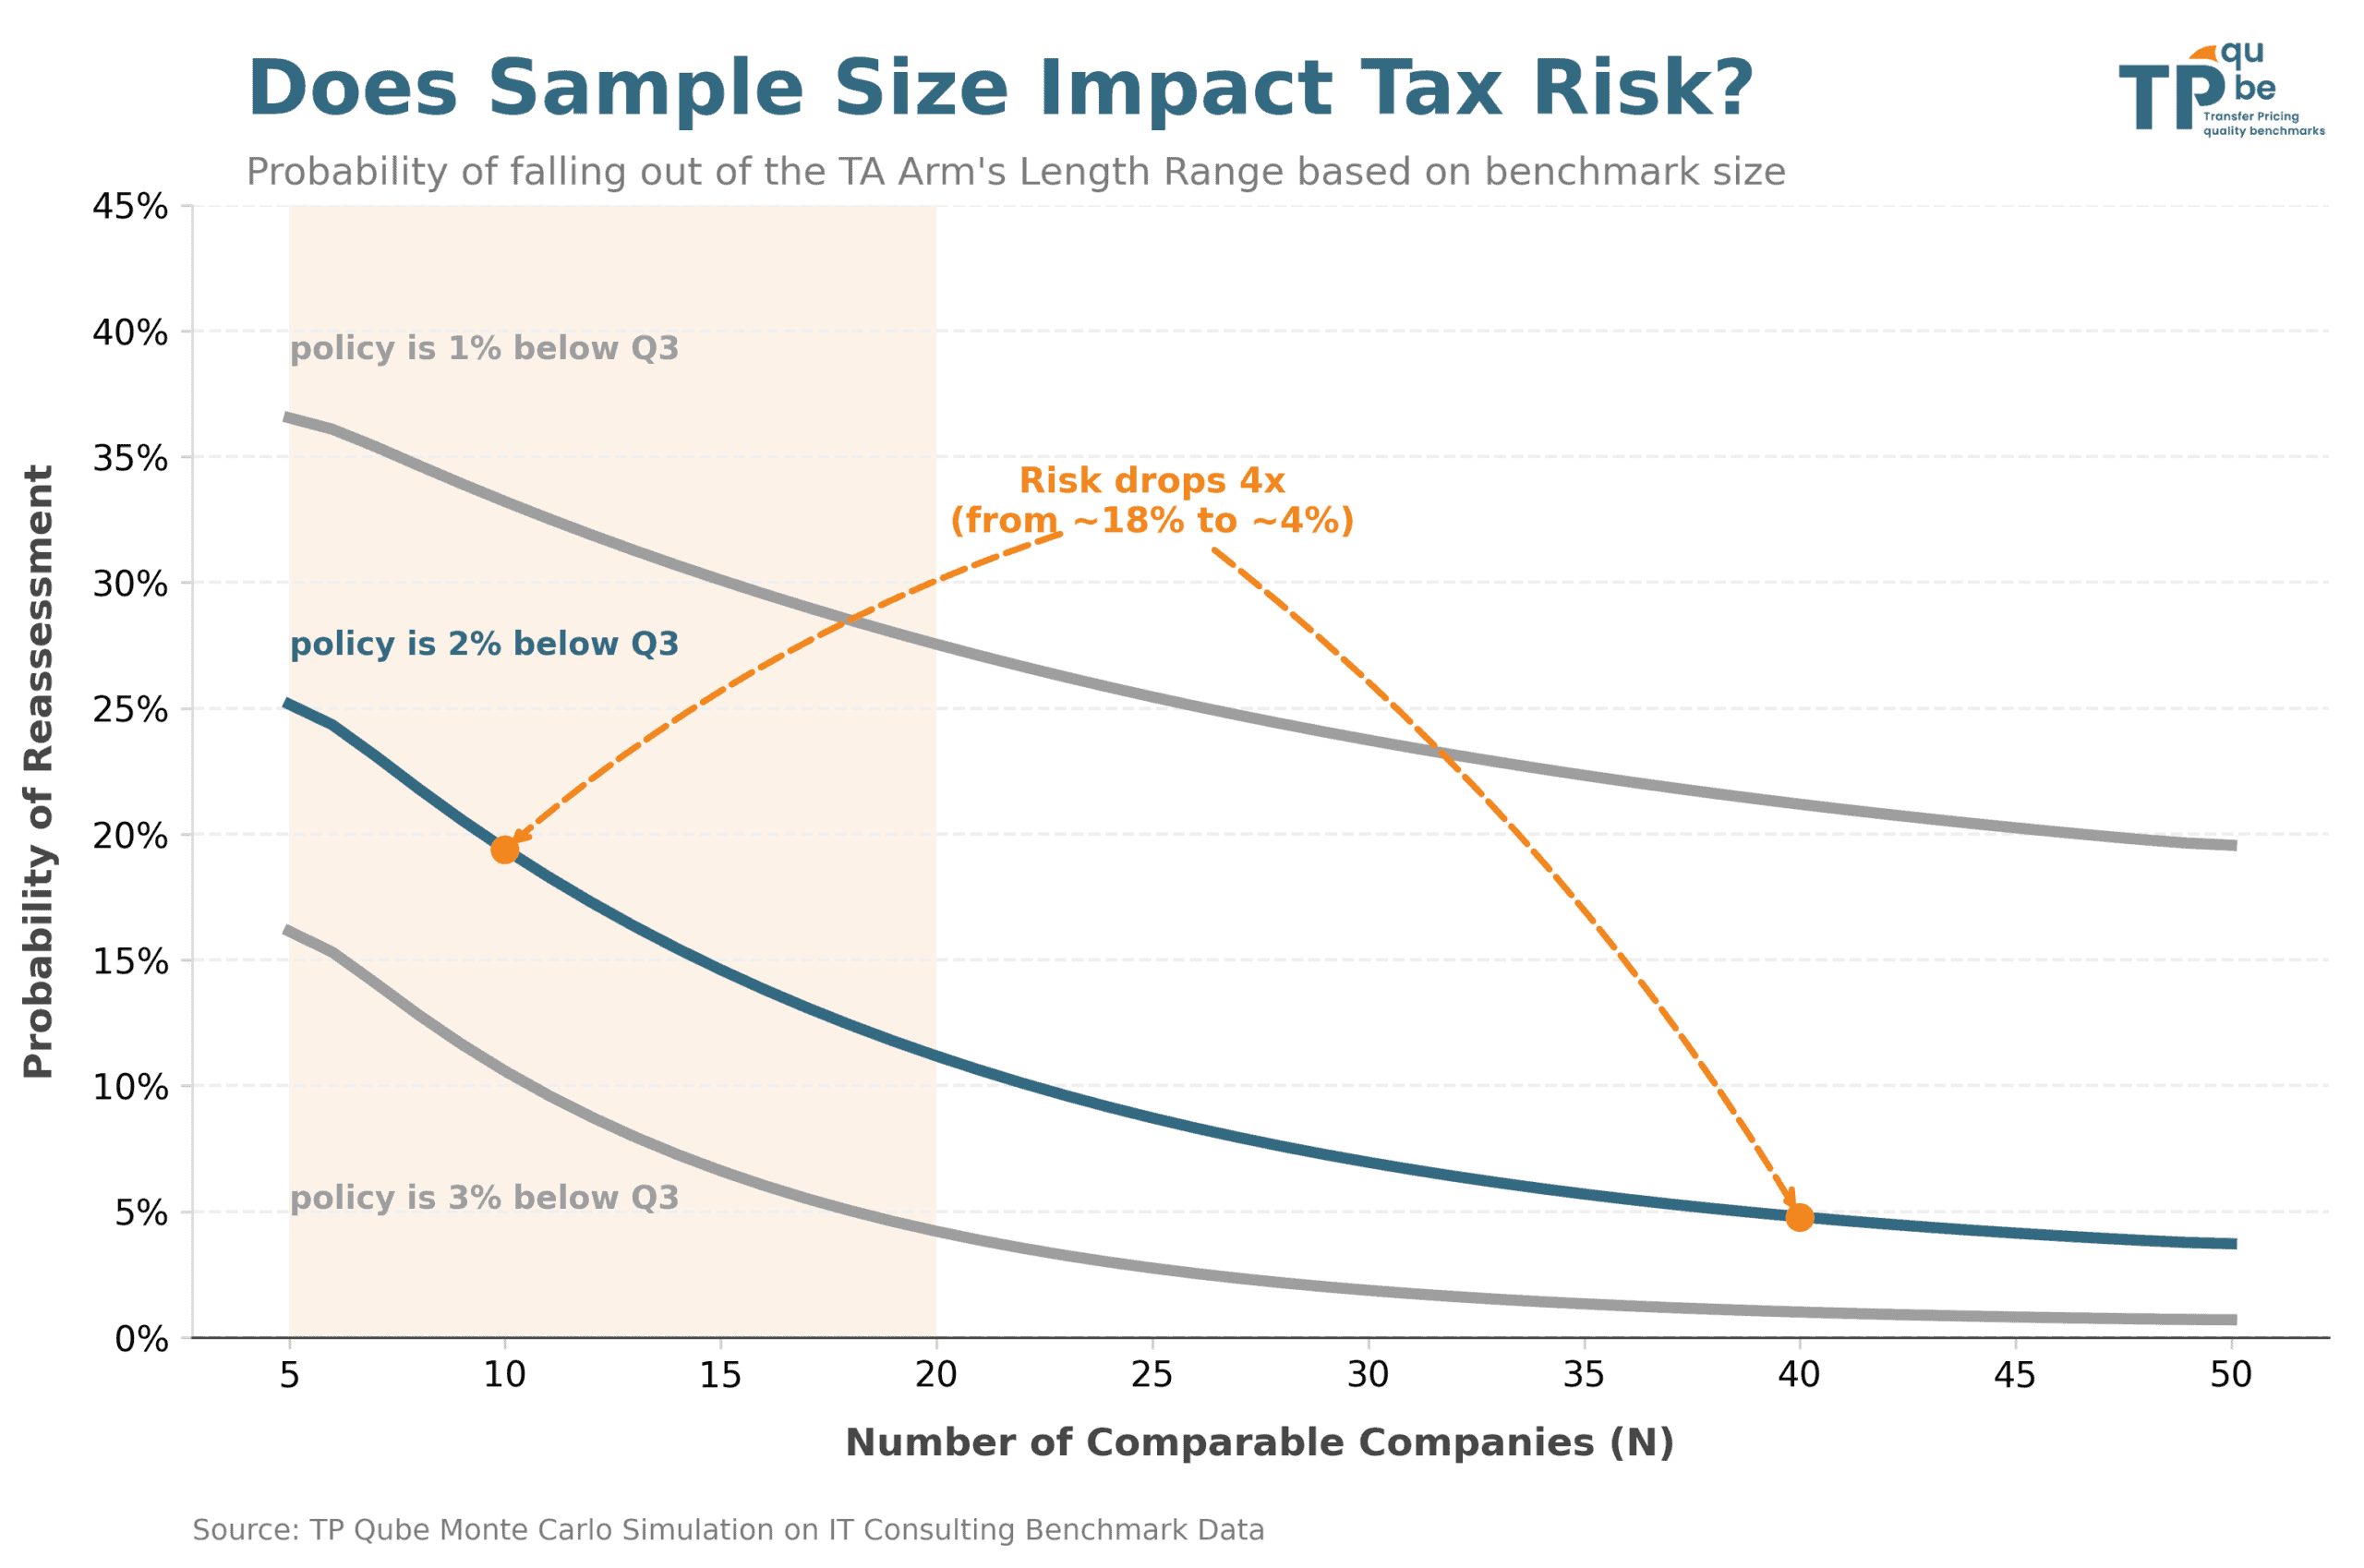
Our findings show that in an IT consulting benchmark, when the tested party’s margin is positioned 2% below the upper quartile, the probability of a reassessment was around 18% for a set of 10 comparable companies). By increasing the sample size, the probability of reassessment drops sharply, at 4% for a set of 40 comparable companies. The main result is best visualized in the last graph.
This article is not a call for larger samples at all costs. As all transfer pricing practitioners know, there is usually a trade-off between the quality and quantity of comparable companies in TNMM searches. But when firms are reasonably comparable, increasing the panel size is always worth considering.
Scope of this Analysis
The optimal number of comparable companies depends on a balance of several factors, including:
- Robustness of the study: The incremental benefit of adding an additional comparable company (e.g., making the range more stable for futures updates but also more resistant to tax authority challenges).
- Selected point in the range: The positioning within the range used for pricing.
- Quality of comparable companies: The comparability of firms (though this is challenging to measure precisely).
- Cost of finding additional (good) comparable companies: Including time, resources, and data access constraints.
In this article, we focus exclusively on: - The robustness of the range as the number of comparable firms increases. - The sensitivity of the selected point in the range (one to three percentage points below the third quartile).
For simplicity, we notably consider the following: - All comparable firms are treated as equally comparable. - Expanding the set of comparable companies is assumed to be feasible easily using an AI tool.
Methodology
The approach comprises three steps.
Step 1: Fitting the Profitability Distribution
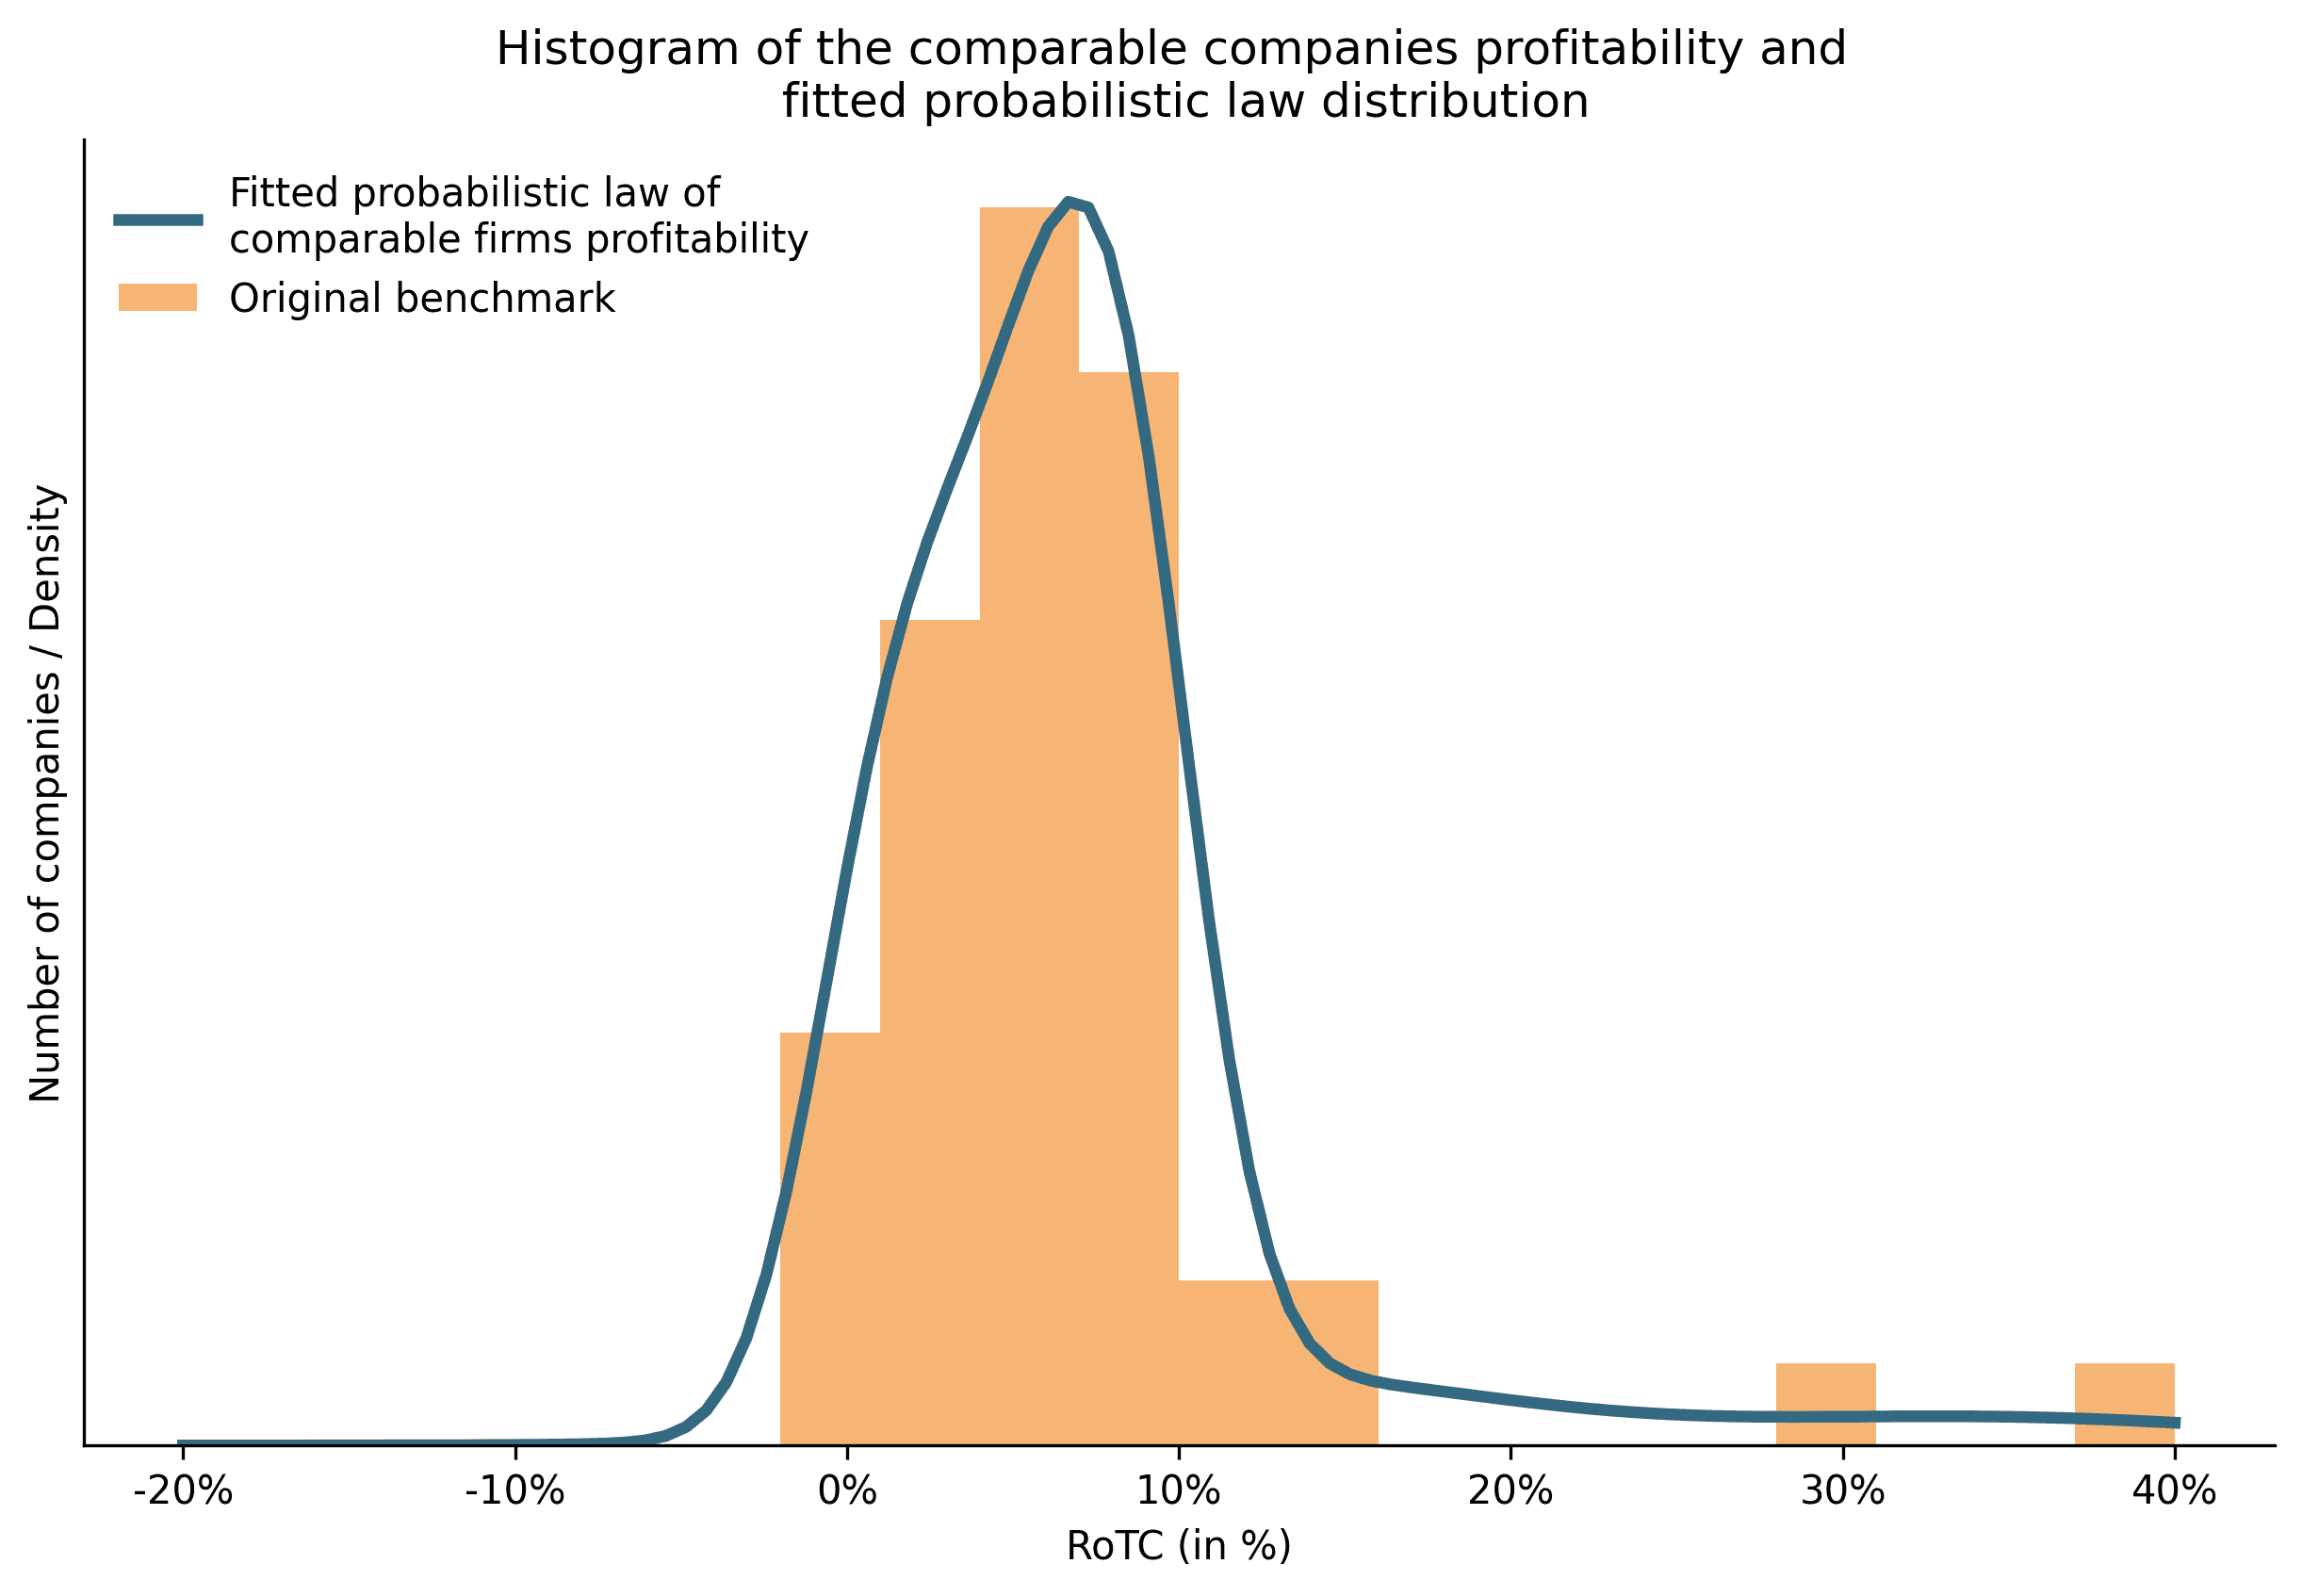
We started by estimating the distribution of comparable firms’ Profit Level Indicators (PLIs), using a large dataset derived from an existing TNMM benchmark for IT consulting activities.[[2]](#footnote) The three-year weighted average PLIs were compiled and used to build a histogram. On this example, the distribution is right-skewed, a typical feature of profitability distributions. A parametric probability distribution was then fitted to this data. The graph below provides the histogram of the profitability of the selected companies as well as the fitted distribution.
Step 2: Simulating Comparable Company Sets
With this parametric distribution, we perform series of simulations, drawing samples of comparable companies in each one:
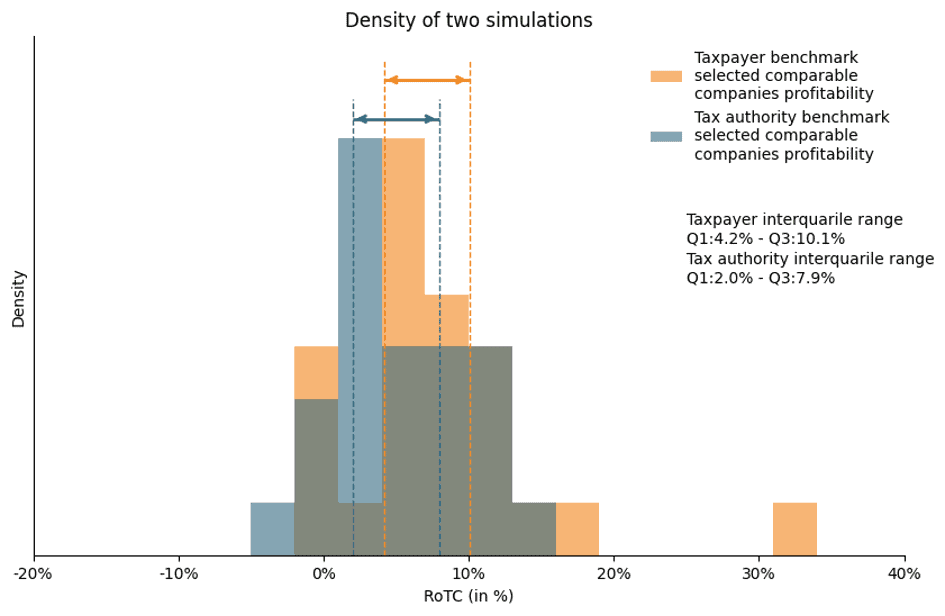
- Taxpayer View: Generates a sample of firms yielding a first and third quartile range, setting the tested party’s margin n percentage points below the third quartile.
- Tax Authority View: Creates a second sample of comparable firms using the same parametric distribution and the same number of comparable companies. For the purpose of this simulation, a "reassessment" is triggered if the taxpayer's selected margin falls outside the Tax Authority’s interquartile range (i.e., it is lower than the Authority's Q1 or higher than the Authority's Q3)
The graph below provides the two simulated density distributions and the associated first and third quartiles.[[3]](#footnote)
Step 3: Monte Carlo Simulation for Reassessment Probability
We repeated the second step across varying numbers of comparable firms and different selected margins (1 to 3 percentage points below the third quartile). This Monte Carlo approach yielded a probability estimate for a potential tax reassessment, depicted on the graph below.
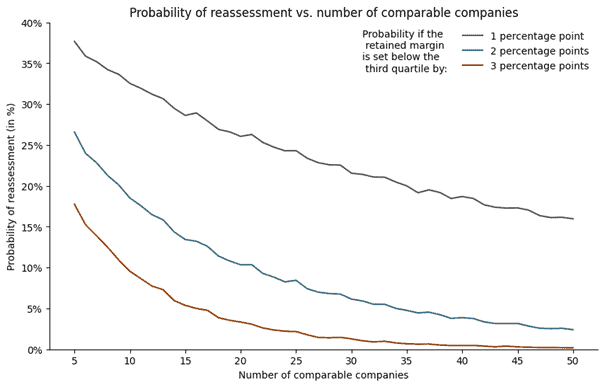
For example, and following this simulation, if the retained margin is 2 percentage points below the third quartile of a benchmark with 12 comparable companies, there is a 14% likelihood that the retained margin is out of range in a new benchmark realized by a tax authority (with the same number of companies). This probability falls to 4% if the number of comparable companies is equal to 40.
Conclusion
8This analysis provides also interesting estimation of the probability of reassessment following different parameters. As expected, this probability increases if:
- If the number of comparable firms decreases.
- The closer the tested party’s margin is to the third quartile.
For a typical IT consulting search with 10 comparable companies, the probability of a reassessment when choosing a point 2% below the third quartile was around 18 %. This number sharply dropped at 4% when increasing the number of comparable companie s to 40. We perform additional simulations in cases where the taxpayer chooses 2% or 3% below the third quartile.
Limitations, discussion & Further Research
This theoretical approach rests on certain strong assumptions, such as:
- The benchmarked activity. Indeed, for some activities the company profitability is significantly skewed creating a lot of variability in the estimation of the third quartile.
- Both datasets (taxpayer and tax authorities) used for benchmarking are unbiased and follows the same functional profile analysis of the tested party.
- The tax authority benchmark is the one that determine the reassessment. It is likely that in the case of a tax audit, there would be a debate on which comparable companies are the most appropriate.
Future analyses will explore the impact of these assumptions and their implications for transfer pricing economic analysis and risk assessments.
[1]: Here considered to be the interquartile range.
[2]: The benchmark aims at benchmarking IT consulting services in France. Even, if this activity is generally under the scope of the low value-added services, this activity has been retained as the basis for the analysis notably because it is possible to have a large set of selected comparable companies so that the fitting of the probability law is sufficiently good to perform analysis.
[3]: For both tax payer and tax administration benchmarks being composed of 19 comparable companies.