
TP qube
This post presents empirical evidence on differences between size distributions for independent manufacturing companies with financial data available on commercial databases across European countries. These differences seem to be primarily due to disparities in financial statement disclosure requirements. As we documented in a previous study, there exists a size premium for independent manufacturing companies in Europe. Hence, transfer pricing practitioners need to carefully define the geographical scope of their studies when looking for comparable data.
To perform comparable company searches, transfer pricing practitioners have to rely on commercial databases such as the ones published by Bureau Van Dijk or Thomson Reuters. These databases are primarily filled using regulatory sources, whose data collection heavily depends on local financial statement disclosure requirements. If listed companies’ data are generally extensive and of high-quality all across the world, the extent to which data on privately-owned corporations are available, varies significantly per country.
It is thus not surprising that companies with certain characteristics may end up being over or under represented, which may result in sample selection biases.
As an example, corporate financial data for firms of all size may not be available in all jurisdictions. The map below presents the median turnover for a large sample of independent manufacturing companies in Europe.
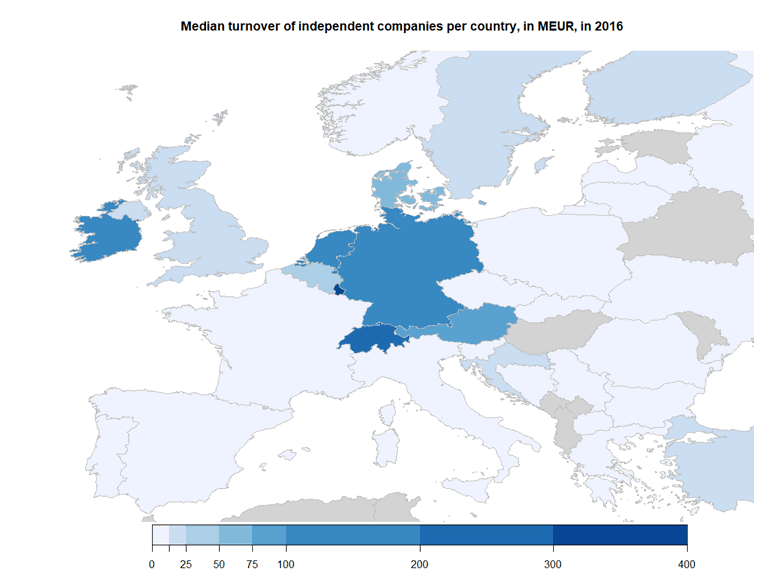
As is clear from this map, independent firms exhibit very high turnover levels in certain geographies, such as Germany where the median turnover is 118 MEUR, Ireland (140 MEUR), or Switzerland (213 MEUR), compared to France (8 MEUR), Spain (8 MEUR) or the UK (16 MEUR).
It is unlikely that this pattern would be solely driven by market differences. We believe that this pattern is often better explained by differences between disclosure requirements of financial data.
For example, Germany has a very high turnover threshold for disclosure requirements (meaning that large firms tend to be forced to disclose their financial statements, and that smaller ones are not), while the threshold is considerably lower in France (source: https://mitsloan.mit.edu/shared/ods/documents/?DocumentID=2843). We believe that this fact explains differences between the median turnover of independent companies in Germany and the one in France. This fact is corroborated by the differences in the full turnover distributions in Germany compared with other comparable European countries (France, Spain and the United Kingdom), displayed in the graph below.
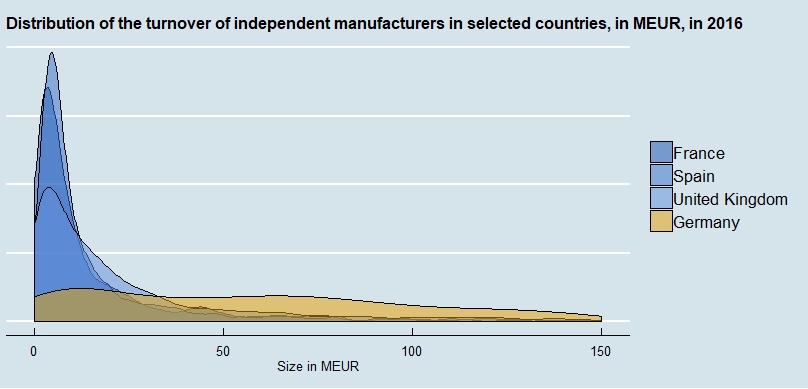
This graph depicts that the size distribution for independent companies of the dataset is sensibly different in Germany compared to other selected European countries. It is unlikely that these differences would come solely from market differences. These differences seem better explained by the differences in financial statement disclosure requirements, as explicated above.
Besides, as we argued in a previous study, there exists a size premium for independent manufacturing companies in Europe, meaning that larger companies tend to have higher Return on Total Costs.
As such, these differences should be taken into account by practitioners. For instance, it would be incorrect to rely solely on large German manufacturing companies to benchmark a small manufacturing subsidiary established in Germany. Relying on an exclusively German panel would result in a panel composed only of large manufacturing companies, which might not be comparable to the small subsidiary to be tested.
To some extent, this is already the case, since practitioners rely on pan-European studies instead of relying on data for a single country. This approach is quite fruitful, especially if one is able to adjust for country differences, grounded in empirical evidence.